A dataset: 4,560 US public companies read by a local LLM, embedded by
what they actually sell, clustered with no sector labels anywhere —
and a set of worked examples showing how to pull market insight out of it.
September 02, 2026 · built with a 14B model on one consumer GPU · a dev log
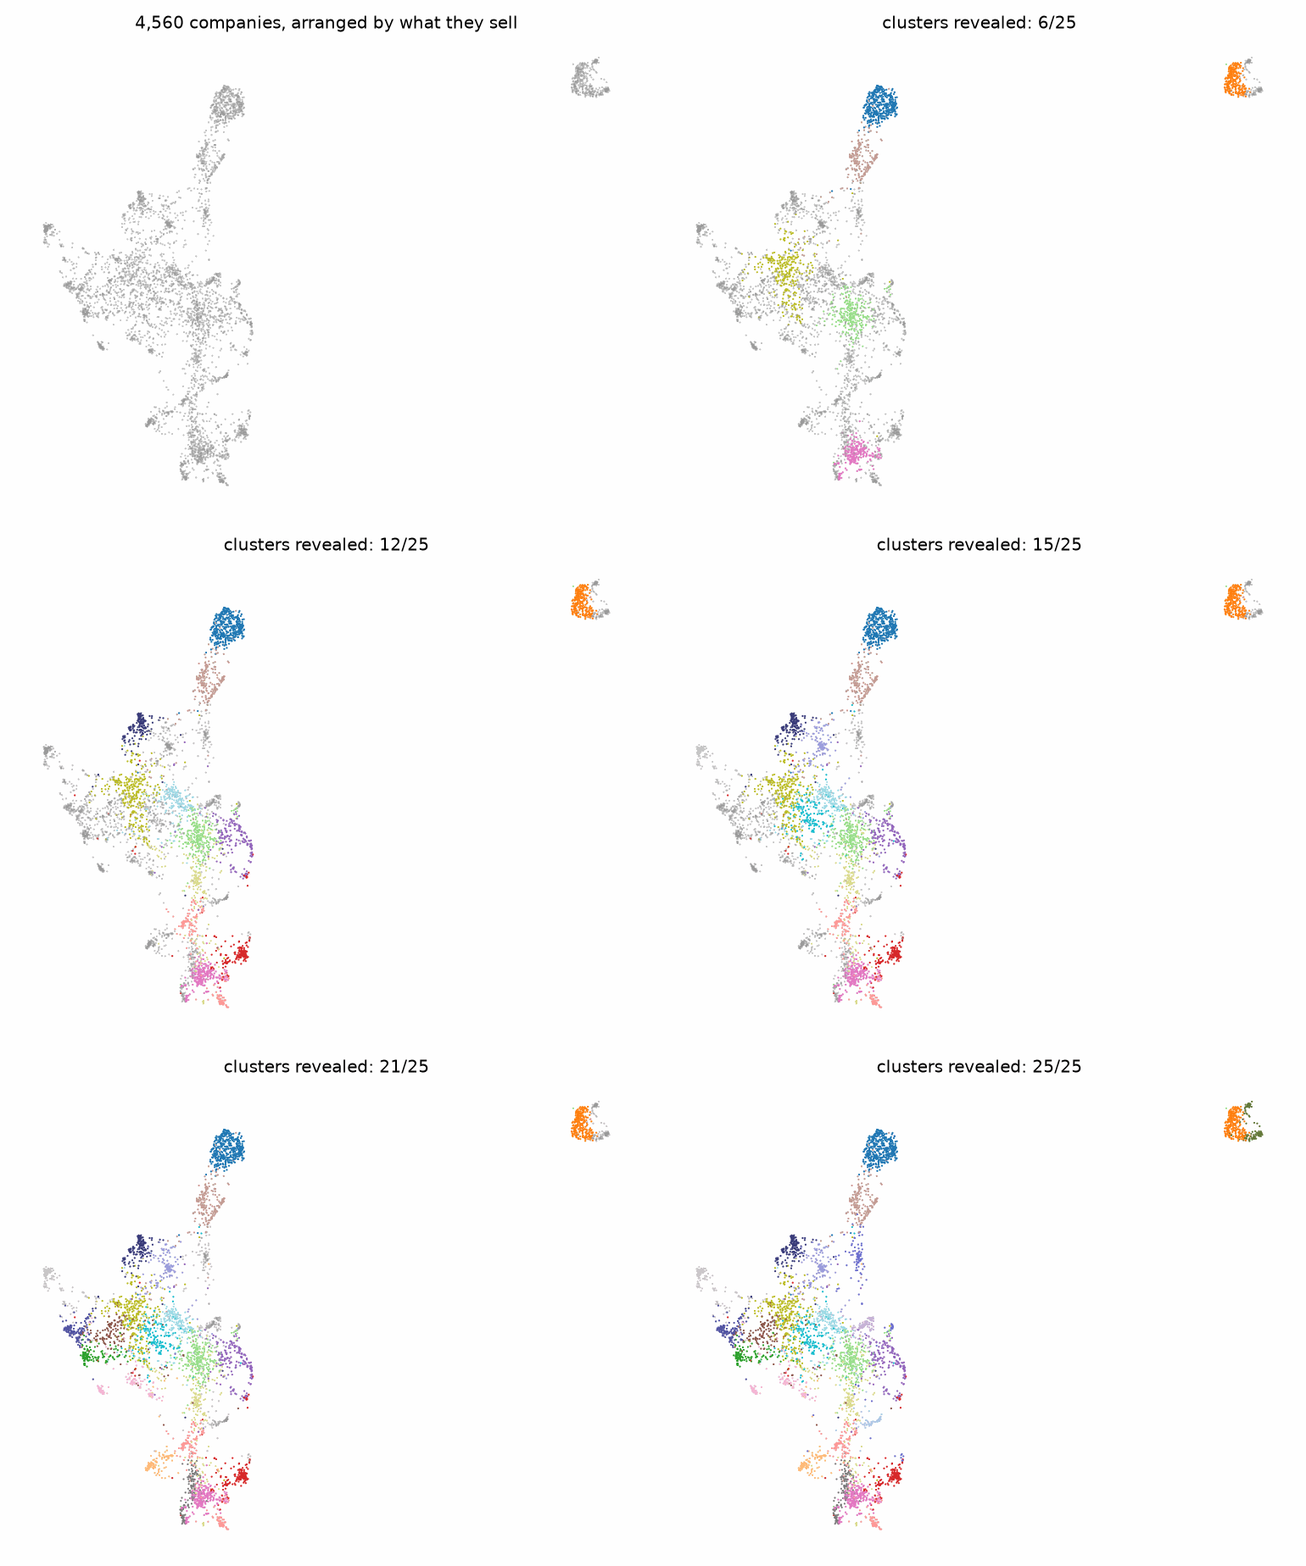
4,560 companies arranged purely by product similarity, clusters revealed.
Part 1 · The dataset
Everything on this site sits on one dataset: a product-level dossier for every
US-listed company above $75M market cap, written by a local LLM reading annual
reports, embedded into vectors, and clustered with zero human taxonomy. Here's
how it was built, step by step.
The problem
Sector labels describe filing cabinets, not companies
Every stock screener sorts companies into the same ~11 sectors and ~160 GICS
industries — a taxonomy committee-designed decades ago. Amazon sits in
"Consumer Discretionary," which tells you nothing about AWS. A defense-tech
startup and a 100-year-old artillery maker share a code. We wanted the opposite:
throw away every label and ask what groups emerge if companies are
compared only by what they say they sell.
Step 1
Teach a machine to read 4,560 annual reports
Every US public company files an annual report (10-K, or 20-F/40-F for foreign
filers) describing its business. We ran a local LLM (Qwen3-14B on one consumer
GPU) over each one with a single question:
PRODUCT_PROMPT = (
    "give me a detailed breakdown on the products this company makes or sells, "
    "who is the product for, what problem does each product solve"
)
The result: one product dossier per company — typically 3,000–10,000
characters. NVIDIA's, for instance, begins:
NVIDIA Corporation is a data center scale AI infrastructure company that specializes in accelerated computing and AI solutions. The company's products and services are designed to address the need for high-performance co…
Building the corpus took about two weeks of background GPU time, with automatic
quality sweeps that re-generated any description that came out as boilerplate
(wrapper documents, amendments filed over the real report, exhibit-99 Annual
Information Forms — annual reports hide their content in more ways than you'd think).
Step 2
Turn words into coordinates
Each dossier goes through an embedding model (bge-m3), which converts text into
a point in 1,024-dimensional space with one crucial property: texts about
similar things land near each other. Companies selling energy drinks end up
neighbors; so do companies selling missile systems.
rows = db.execute(
    "SELECT d.ticker, p.company_name, p.market_cap, v.vector "
    "FROM company_business_descriptions d "
    "JOIN company_vectors v ON v.ticker = d.ticker "
    "LEFT JOIN company_profiles p ON p.ticker = d.ticker").fetchall()

X = np.vstack([np.frombuffer(r["vector"], dtype=np.float32) for r in rows])
X = X / np.linalg.norm(X, axis=1, keepdims=True)   # unit sphere -> cosine geometry
Step 3
Let the clusters find themselves
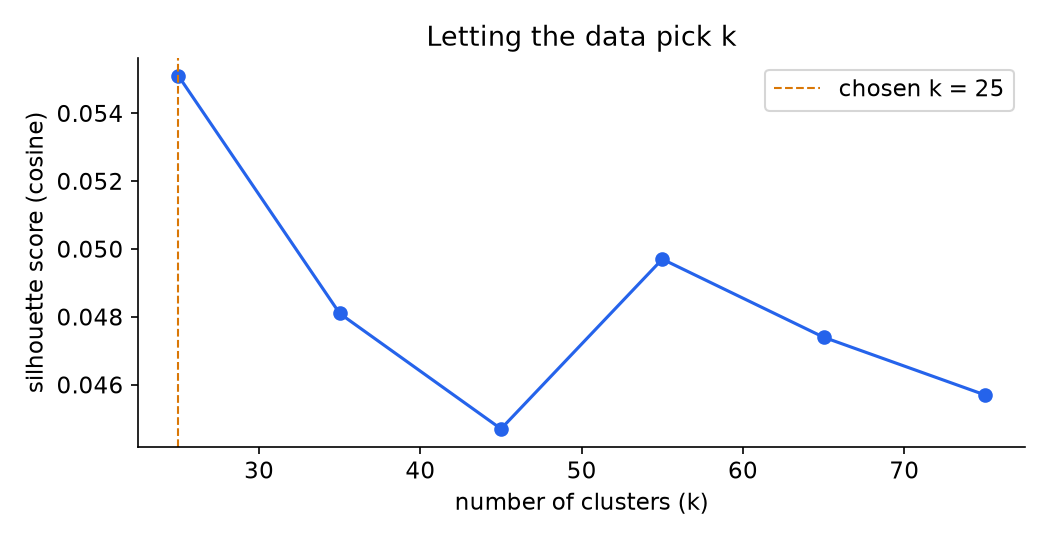
We ran spherical k-means over the embeddings — and let the data choose how
many clusters exist, by sweeping k and scoring each split with the silhouette
coefficient (how much closer each company is to its own cluster than the next
nearest one):
for k in [25, 35, 45, 55, 65, 75]:
    km = KMeans(n_clusters=k, n_init=4, random_state=42)
    labels = km.fit_predict(X)
    sil = silhouette_score(X, labels, metric="cosine")   # best k wins
The sweep. k = 25 won — the data prefers a few dozen broad
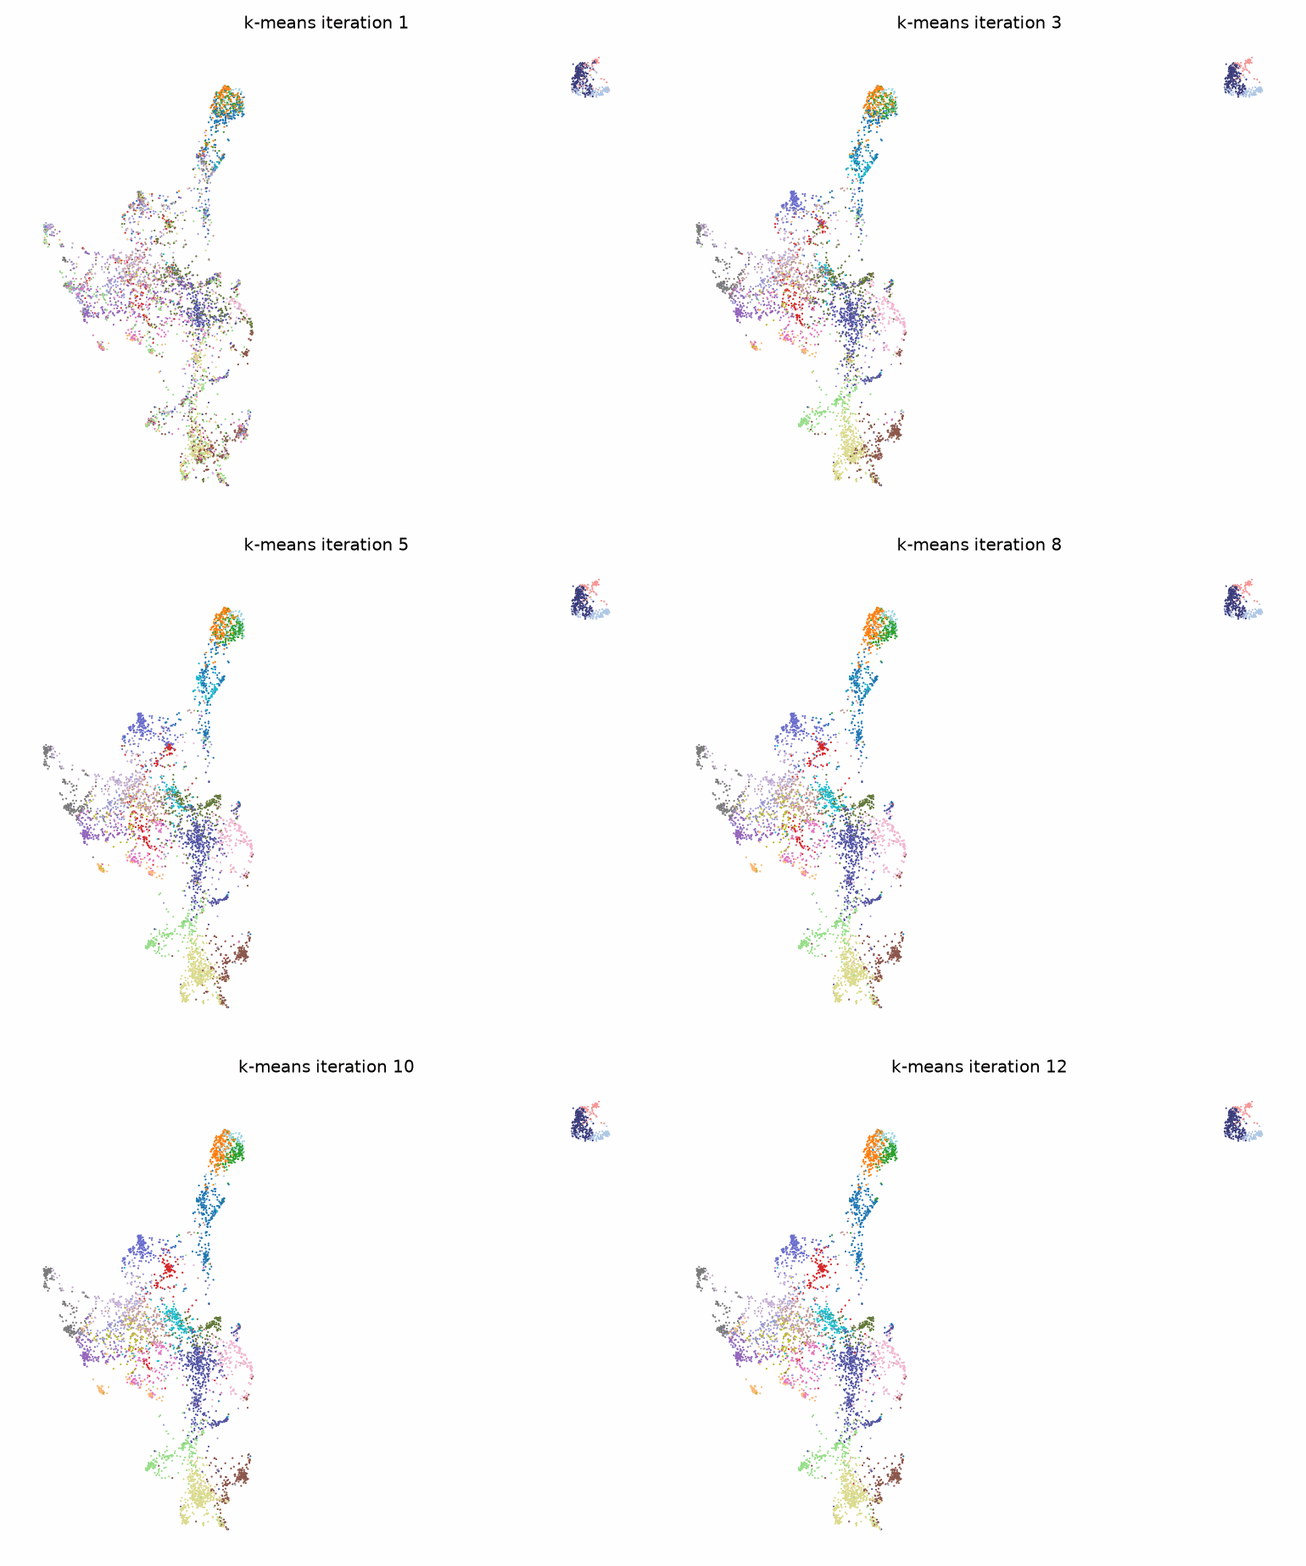
families over hundreds of micro-niches.The clusters finding themselves: k-means assignments converging,
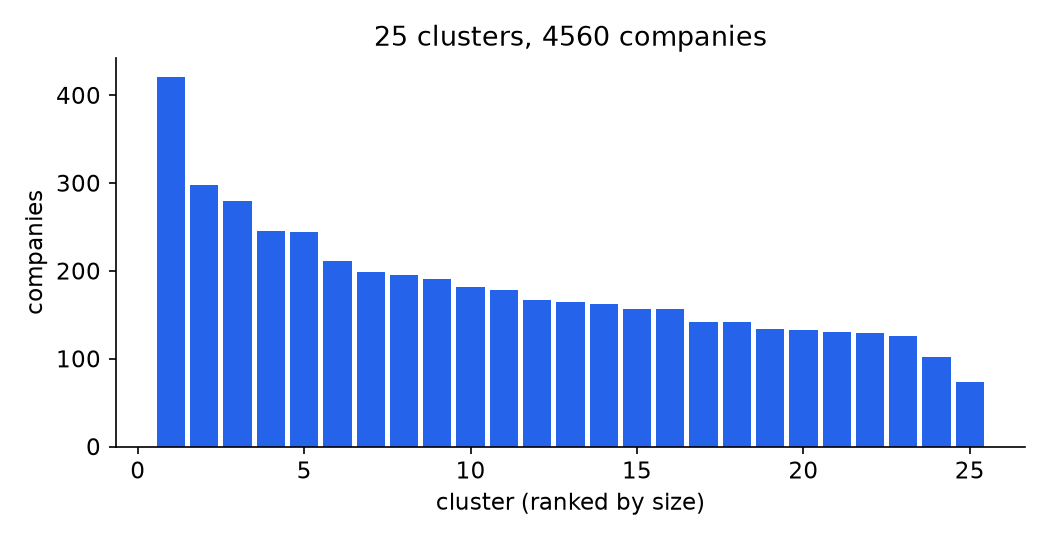
iteration by iteration.Cluster sizes: largest 421, smallest 73 companies. No degenerate mega-cluster.
Step 4
Name what emerged
The clusters exist without names — so we reverse-engineered each one. The
LLM sees the 12 companies nearest each cluster's center and must say what unites
them, with sector words explicitly banned:
SYSTEM = ("You name emergent groups of companies discovered by clustering what "
          "they actually sell. RULES: never use stock-market sector or industry "
          "labels. Instead, name the specific shared thing: what these companies "
          "all sell, who they sell it to, or the problem they all monetize.")

label = chat_json(members_text, system=SYSTEM, schema={
    "name": ..., "one_line": ..., "common_thread": ..., "description": ...})
Some of what emerged matches intuition — a beverage family, a defense-prime
family, a money-center-bank family. Some of it doesn't: the embeddings split
"semiconductors" into distinct businesses (platform giants selling AI
infrastructure vs. broad-line chipmakers), a distinction no sector code makes.
The full directory of all 25 clusters is the Atlas at the
bottom of this page.
Step 5
Draw the map
1,024 dimensions don't fit on a screen, so we used UMAP to press the cloud
into 2D while preserving neighborhoods. Every dot below is a real company;
hover to identify it, click legend entries to isolate clusters.
switch to "circle to compare", then draw a loop around any
group of dots to overlay their stock charts
Part 2 · Deriving market insight
A dataset is only as good as the questions it answers. Three worked examples,
each chaining the corpus with live market data:
Example 1: Do neighbors trade together?
The map places companies by what they sell. Markets place them by
how they trade. Circle any patch of dots on the map above (switch to
"circle to compare") and the site pulls each company's daily closes (via a tiny
serverless proxy in front of a market-data API, so no key ships to the browser),
overlays them as percent-change-since-window-start, and computes the average
pairwise correlation of their daily returns:
Try circling the titanium-chemicals neighborhood on the map's left side
(Tronox, Kronos, Chemours sit within a coin's width of each other) or a slice of
the bitcoin-mining island in the corner — then compare against a random
scribble across the middle. Tight product families tend to show correlations
well above a grab-bag of strangers, but the exceptions are the interesting part.
Example 2: The Inverse AI Trade
A transcript screener found 19 companies whose analysts pressed management on
AI eating the core business — and no defense convinced them. We expand
that list through this embedding corpus to find related companies the screener
never saw (it found Shutterstock at -74% sitting right next to flagged Getty
Images at -86%), price the whole universe with live market data, and rank who
has the most torque if the AI hype bursts.
FINRA short interest for the whole market, with "high" defined relative to
company size (3.4% is loud for a mega cap; small caps need 16%), painted over
this map as a density-lift surface. The bears cluster in a handful of product
neighborhoods: a clinical-stage biotech ridge, a crypto-mining island, a
space-and-autonomous-tech pocket, and one surprise in kids' nutrition.
Companies whose stock did 0% or worse over 1, 3, or 5 years while the
business grew revenue 15%+/yr — or while the market was paying a
top-quartile revenue multiple for growth that never came. Expectations measured
two ways (realized growth, and the starting P/S the market itself paid, with
dilution-proof share counts), split into "delivered but de-rated" vs "priced
for growth that never came," and mapped as a de-rating density surface.
Some executive pay only vests if the stock hits specific prices by a
specific date. A standing scan reads every proxy statement for those price
hurdles, checks the tape, and posts companies trading far below their
executives' vesting thresholds — updated as the scan runs.
Forty-seven companies call themselves AI clouds. Each becomes a point cloud
in two spaces — what its business says, what its technical documentation
proves — plus an activity fingerprint from its year of events. Business
language says "GPU cloud" for twenty; the docs prove it for ten; the event
streams say several are still bitcoin miners.
Every company in the situational event corpus whose past year contains an
NVIDIA partnership announcement — a real one, hand-separated from board
appointments and name-drops — and what the stock did 1 day, 1 week, and
6 months after the announcement, net of the market. Partnerships where NVIDIA
is the counterparty pop on day one; the median gives it back within a week.
Generate this kind of market insight on your own GPU
Every number on this site — the corpus, the embeddings, the clusters, the
studies — came out of FNTK Pro Local, an open-source stack that runs a
14B LLM, local embeddings, and SEC-filing analysis on a single consumer GPU. No
cloud model calls; your research stays on your machine.
All companies focus on creating medicines for patients with rare conditions, often with small patient populations and high unmet medical need.
This group consists of biopharmaceutical companies that specialize in developing and commercializing treatments for rare and ultra-rare diseases, often with limited or no existing therapies. Their products target specific genetic or protein-related disorders, such as cystic fibrosis, Parkinson’s disease, achondroplasia, and various rare metabolic or neurological conditions. These companies serve a niche patient population, often relying on orphan drug designations and specialized reimbursement models. The economics are driven by high pricing due to the small market size and the significant unmet medical need, with a focus on innovation and clinical differentiation.
They all produce or distribute robust, specialized parts and materials used in heavy machinery, construction, transportation, and industrial applications.
This group consists of companies that manufacture or distribute essential components and materials for heavy machinery, vehicles, and industrial infrastructure. Their products include construction and mining equipment, specialty metals, filtration systems, structural plastics, and industrial fasteners. These companies serve a wide range of industries, including construction, transportation, energy, and manufacturing, by providing durable, high-performance materials and parts that are critical for equipment operation and infrastructure development. Their business models are driven by demand for reliable, long-lasting components in harsh environments.
Most representative members
mcap
CAT
Caterpillar Inc.
$387.9B
CLMT
Calumet Inc.
$3.4B
GLW
Corning Inc
$142.7B
CC
The Chemours Company
$2.4B
DOV
Dover Corporation
$28.4B
CMT
Core Molding Technologies, Inc.
$0.2B
PKX
POSCO Holdings Inc.
$17.5B
CRS
Carpenter Technology Corporation
$28.4B
All members: AAON AAP ABAT ABG ACNT ADM ADNT AEBI AGCO AIN AIRJW ALB ALG ALH ALTM ALTO AMCR AMRZ AP APD APOG ARQ ASH ASIX ASPN ASTE ASTL ATKR ATMU ATS AVNT AVY AWI AXTA AZO AZZ BAK BCC BCPC BECN BGSI BLD BLDR BLL BOOM BRC BWA BXC CAAS CARR CAT CBT CC CCK CE CF CLF CLMT CLW CMC CMCO CMI CMP CMT COOK CPAC CPS CREE CRH CRS CSL CSTE CSTM CSW CTVA CVCO CVGI CX CYD DAN DCH DCI DD DDD DE DOO DORM DOV DOW DPC EAF EBF ECL ELA EML EMN ENR ESAB ESI EXP EXPO F FAST FF FMC FOXF FRD FSLR FSS FSTR FUL GENC GFF GGB GGG GHM GIC GLW GM GMS GPC GPI GRWG GSM GT GTES GTX GWW HDSN HLLY HLMN HLP HNI HOG HUN HURC HY IBP IEP IEX IIIN INV IOSP IP IPX ITW JBI JBTM JCI JELD JHX KAI KALU KEQU KMT KODK KOP KRNT KRO KWR LCII LEA LECO LEG LGN LI LII LIN LKQ LODE LPX LUD LXFR LYB MAGN MAIR MATV MATW MEC MGA MGRC MHK MLI MLM MLR MMM MNRO MOD MPAA MSM MT MTRN MTUS MTW MTX MYE NDSN NEU NGVT NPK NPKI NPT NTIC NUE NX OC ODC OEC OFLX OLN ORLY OTTR PACK PATK PCTTU PHIN PII PKG PKOH PKX PLOW PLPC PPG PRLB PRM PSIX PSNY QXO RAIL RLX ROAD ROCK RPM RS RTO RYAM RYN RYZ SAH SCL SHW SIM SITE SLGN SLVM SMID SMJF SMP SNA SOLS SON SSD STLA STLD SUZ SW SWK TEX TG TGLS THO THRM TILE TITN TKR TNC TREX TRN TRS TT TTAM TTC TWI TX UCTT UFPI UNF UTI VFSWW VHI VIRC VLTO VMC VMI VVV WDFC WFG WGO WLK WOR WS WSO WXM WY XMAX XPEL YETI ZKH
AI-Driven Enterprise Solutions · 279 companies
They all offer enterprise-focused software and services that integrate AI, data analytics, and digital transformation to improve business operations.
This group consists of companies that provide AI-driven tools, data management platforms, and digital transformation services to enterprises. Their customers are large organizations seeking to streamline workflows, enhance security, and improve decision-making through advanced analytics and automation. These companies monetize the growing demand for AI integration, data governance, and cloud-based solutions in the enterprise space. Their products range from AI observability tools and data catalogs to hybrid cloud platforms and digital engineering services.
Most representative members
mcap
NOW
ServiceNow, Inc.
$129.1B
TDC
Teradata Corporation
$2.6B
DT
Dynatrace, Inc.
$14.3B
CRM
Salesforce, Inc.
$157.9B
CHKP
Check Point Software Technologies Ltd.
$13.1B
CINT
CI&T Inc
$0.5B
IBM
International Business Machines Corporation
$223.5B
NSIT
Insight Enterprises, Inc.
$4.5B
All members: ACN ADBE ADP ADSK ADT AGYS AI AIIA AIOT AKAM ALLT ALRM AMPL AMTM ANET API APPN ARQQ ASAN ASUR ATEN ATGL AUDC AUR AVGO AVPT BABA BAH BAND BBAI BKSY BLKB BLZE BNAI BOX BRAI BSY BZ CACI CALX CBRS CCCS CCSI CDAY CFLT CGNT CHGG CHKP CINT CLBT CLMB CLVT CMRC CNXC CNXN COUR CRM CRNC CRWD CRWV CSPI CSQR CTSH CVLT CXDO CXM CYBR DAVA DAY DBX DCBO DDOG DELL DFIN DHX DOCN DOCU DOMO DOX DSP DT DUOT DVLT DXC EFOR EGAN EGHT EPAM EQIX ESTC EXLS EXTR FA FATN FC FCN FDS FFIV FIG FIVN FORTY FROG FRSH FSLY FTNT G GCT GDDY GDYN GEN GIB GLOB GNSS GOOG GOTU GPRO GRRR GTLB HAWK HCKT HPE HPQ HQ HUBS HURN IBEX IBM ICFI III IIIV INFA INOD INTA IONQ IOT IQMX IRM IT J JCOM JNPR KARO KC KD KDK KELYB KLTR KVSB KVYO LAW LFTO LIF LOPE MAN MANH MCHX MDB META MGRT MHH MNDY MSI MTCH MWC NABL NAVN NBIS NET NICE NIQ NN NOW NRDY NSIT NSP NTAP NTCT NTNX NTSK NVDA OCTV OKTA OOMA OPRA ORCL OSPN OTEX P PAGS PANW PAR PAYC PAYX PCTY PD PDYN PEGA PERF PL PLTR PRGS PSO PSTG PTC QBTS QLYS QMCO RAMP RBRK RDVT RDWR RDZN REKR RGP RMNI ROC ROP RPD RR RXT RZLV S SAIC SAIL SANG SAP SCSC SDGR SIFY SILC SKIL SMWB SNOW SOUN SPT SSTI SUPX TBI TBLA TCGL TDC TEAM TENB THRY TLS TRI TRMB TSSI TTD TTEC TTGT TUYA TWLO TYL UIS ULS UPWK VERI VERX VIA VNET VRNS VRSN VTEX VYX WDAY WDC WEAV WIT WK WYY XNDU XRX YEXT ZENA ZETA ZIP ZM ZS
Regional Commercial and Residential Lenders · 245 companies
They all offer loan products to individuals and businesses for real estate and operational financing, primarily in local markets.
This group consists of regional banks and financial institutions that specialize in offering commercial and residential real estate loans, as well as commercial and industrial (C&I) loans. Their primary customers include homebuyers, small and middle-market businesses, and commercial entities seeking financing for property purchases or operational needs. These companies generate revenue by charging interest on loans and fees for financial services, and they operate mainly in local or regional markets, often with a focus on community banking.
All these companies are SPACs designed to raise capital by going public and then merge with or acquire private companies.
This group consists of Special Purpose Acquisition Companies (SPACs), also known as blank check companies, which do not currently operate or sell products or services. Instead, they raise capital through initial public offerings (IPOs) with the goal of merging with or acquiring a private company, typically in a specific industry or sector. These companies are in the process of identifying a target business to combine with, and their primary economic activity is facilitating such a business combination. Their customers are typically investors who buy shares in the SPAC during the IPO, hoping to benefit from the future performance of the acquired company.
Most representative members
mcap
QLEP
Quantum Leap Acquisition Corp
$0.2B
HCMA
HCM Acquisition Corp
$0.1B
ARTC
Art Technology Acquisition Corp.
$0.3B
GSRV
GSR V Acquisition Corp.
$0.4B
YCY
AA Mission Acquisition Corp. II
$0.2B
ILLU
Illumination Acquisition Corp I Class A Ordinary Shares
$0.2B
SAC
Safeguard Acquisition Corp.
$0.3B
SVAQ
Silicon Valley Acquisition Corp. Class A Ordinary Shares
These companies all design, manufacture, and market specialized medical devices and systems that improve diagnostic accuracy, treatment efficacy, or procedural precision in clinical environments.
This group includes companies that create cutting-edge medical devices and systems used in hospitals, clinics, and interventional labs. Their products range from robotic systems for complex procedures, like those used in cardiology and neurology, to diagnostic tools and consumables for infusion therapy, vascular access, and pathology testing. These companies serve healthcare providers, hospitals, and medical institutions, solving problems related to patient care, treatment accuracy, and procedural efficiency. Their economics are driven by innovation, regulatory approvals, and the need for high-quality, reliable medical solutions in an increasingly complex healthcare landscape.
Most representative members
mcap
A
Agilent Technologies, Inc.
$41.2B
STXS
Stereotaxis, Inc.
$0.1B
MMSI
Merit Medical Systems, Inc.
$5.3B
ABT
Abbott Laboratories
$186.5B
BVS
Bioventus Inc.
$1.0B
ICUI
ICU Medical, Inc.
$4.6B
FLGT
Fulgent Genetics, Inc.
$0.5B
BSX
Boston Scientific Corporation
$73.3B
All members: A ABT ADPT AED AIRS ALC ALGN ALMR AMGN ANGO ANIK AORT APYX ATEC ATR ATRC AVR AVTR AXGN AZTA BAX BBNX BDSX BDX BDXA BFLY BHC BIO BLCO BLFS BLLN BNTX BRKR BSX BVS BWAY CAI CARL CBLL CDNA CDXS CERS CERT CLPT CMLFU CNMD CNXU CRL CSTL CTKB CV DGX DHR DNA DVA DXCM ELAN ELMD ENOV ESTA EVO EW EXAS FLGT FMS FOCL GEHC GH GKOS GMED GRAL GRFS HAE HLN HOLX HROW HSDT HTFL HUMA HYPR IART ICCC ICUI IDXX ILMN IMDX INFU INGN INMD INSP IRMD IRTC ISRG ITGR KIDS KMTS KRMD LAB LFCR LFVN LH LIVN LMAT LMRI LUCD LUNG MASI MASS MBOT MDT MDWD MDXG MLAB MMED MMSI MOBI MRVI MTD MTLS MXCT MYGN NAGE NAUT NEO NEOG NNNN NPCE NRXS NTRA NVST OABIW OBIO ODD OFIX OM OPRX ORGO ORMP OSUR OWLT PACB PAHC PDEX PEN PHG PLSE PMI PODD PRCT PROF PSNL QDEL QGEN QTRX RCEL RDNT RDY RGEN RMD RPID RVTY RXST SEER SENS SEPN SERA SGHT SHC SI SIBN SKIN SLP SMTI SNN SOLV SOPH SSII SSYS STAA STE STVN STXS SYK TCMD TECH TEM TFX TKNO TLSI TMCI TMDX TMO TNDM TRIB TWST TXG UTMD VANI VATE VCEL VCYT VEEV VREX WGS XGN XRAY YDES ZBH ZTEK ZTS ZYBT
Entertainment and Leisure Platforms · 199 companies
These companies all enable or facilitate entertainment, gaming, or leisure experiences through digital or physical platforms.
This group includes companies that offer platforms for gaming, live streaming, content distribution, and event hosting. Their primary customers are consumers seeking entertainment, gamers, and businesses looking to reach audiences through advertising or content. The economics are driven by subscriptions, advertising revenue, and in-app purchases. These companies solve the problem of providing access to entertainment and leisure activities in a variety of formats, from live streaming to physical events.
Most representative members
mcap
GME
GameStop Corp.
$8.6B
IQ
iQIYI, Inc.
$1.3B
CZR
Caesars Entertainment, Inc.
$6.1B
ROKU
Roku, Inc.
$22.7B
HUYA
HUYA Inc.
$0.6B
DIS
The Walt Disney Company
$182.2B
MGM
MGM Resorts International
$11.2B
VSNT
Versant Media Group, Inc. Class A
$5.5B
All members: ABNB ACEL AENT AMC AMCX AMZN ANGX APP APPS AREN ATAT ATHM BALY BATRA BIDU BILI BKNG BMBL BRSL BRZE BSP BUUU BV BYD CCO CDRO CDW CHDN CHH CNK CPHC CPNG CRTO CTW CURI CZR DAO DDI DIS DJCO DKNG DOYU DRH DUOL DV EA EDR EDU EXPE FBYD FIRY FLL FLUT FORR FOX FOXA FUBO FVRR FWONA FWONK GDEVW GENI GETY GHG GIBO GLOO GME GRND GRPN GRVY GTN H HAS HBNB HERE HGV HITI HKD HLT HTHT HUYA IBTA IHG IHRT IMAX IMMR INSE IPG IQ JBLU JOYY LAMR LEE LION LLYVK LNW LSXMA LUCK LVS LYV MANU MAR MCRI MCS MGM MGNI MLCO MMYT MNTN MOMO MRDN MSC MSFT MSGE MSGS MTN MYPS NCMI NEXN NFLX NMAX NTES NWS NXST NYT OMC OUT PENN PERI PINS PLAY PLBY PLTK PODC POWW POWWP PPHC PPLI PRKS PRSU PSKY QMMM QUAD RBLX RDDT RHI RHP RICK ROKU RRR RSI RSVR RUMBW SABRP SCHL SE SEG SGHC SIRI SNAP SOHU SONY SPHR SPOT SRAD SSP SSTK STGW STRZ STUB TAL TCOM TDAY TKO TME TNL TP TRIP TRVG TSQ TTWO TZOO U VENU VIAC VSNT WB WBD WBTN WH WIX WMG WPP WYNN XMTR XPOF YALA YELP ZH
Semiconductor Test and Manufacturing Equipment · 195 companies
These companies provide tools, systems, and services essential for the production, testing, and performance optimization of semiconductors.
This group includes firms that develop and supply semiconductor manufacturing equipment, testing systems, and related components used in the production of advanced chips. Their customers include semiconductor manufacturers, data centers, and defense and aerospace industries. These companies solve problems related to ensuring the quality, performance, and reliability of semiconductors through precision testing, high-speed data transmission, and advanced manufacturing processes. Their economics are driven by the demand for cutting-edge chips in AI, 5G, and high-performance computing.
Most representative members
mcap
COHR
Coherent, Inc.
$74.2B
MTSI
MACOM Technology Solutions Holdings, Inc.
$23.7B
IMOS
ChipMOS TECHNOLOGIES Inc.
$1.8B
AMD
Advanced Micro Devices, Inc.
$788.2B
TER
Teradyne, Inc.
$59.3B
TSM
Taiwan Semiconductor Manufacturing Company Limited
$2178.5B
VLN
Valens Semiconductor Ltd.
$0.2B
SMTC
Semtech Corporation
$13.0B
All members: AAOI ACLS ACMR ACTG ADI ADIG AEHR AEIS AEVA AIP ALAB ALGM ALMU ALTR AMAT AMBA AMBQ AMCI AMD AMKR AMPG AMPX ANSS AOSL APTV ARBE ARM ARRY ARW ASML ASX ASYS ATOM AVT AXTI AYI BHE BLDP CAMT CDNS CEVA CGNX CLS COHR COHU CRDO CRUS DAKT DIOD DLB DQ ECX ECXWW ENTG ENVX FEIM FN FORM FWDI GCTS GEOS GFS GNTX GSIT HIMX HSAI ICHR IIVI IMOS INDI INFQ INGM INIO INTC INTT INVZ IPGP ISPR JBL JKS JLHL KE KLAC KLIC KN KOPN LAES LASR LINK LITE LOGI LOT LPL LPTH LRCX LSCC LTRX LWLG LYTS MBLY MCHP MEI MKSI MPWR MRAM MRVL MTSI MU MVIS MVST MX MXL NEGG NIO NIU NNDM NOVT NOVTU NVEC NVMI NVTS NVX NXPI NXT OLED ON ONTO OPTXW OSS OUST PDFS PENG PI PLAB POET PONY POWI POWL PSACU Q QCOM QNC QNT QRVO QS QSI QUBT QUIK RGTIW RIVN RMBS SANM SES SHMD SIMO SITM SKHY SKYT SKYX SLAB SMCI SMTC SNDK SNPS SNX SOTK STM STX SVCO SWKS SYM SYNA TER TRT TSEM TSM TTMI TXN UFPT UMC VC VECO VELO VGNT VIAV VICR VLN VSH VUZI WOLF WRD XPEV ZBRA ZJK ZK
Digital Payment Facilitators · 191 companies
These companies all facilitate the movement of money through digital payment systems, often involving credit, debit, and cross-border transactions.
This group consists of companies that provide digital payment solutions, including credit and debit card processing, cross-border payments, and financial management tools. Their primary customers include consumers, small and medium-sized businesses, and financial institutions. They solve the problem of making and receiving payments efficiently and securely in a globalized economy. Their economics are driven by transaction fees, subscription models, and data analytics.
Wealth Management and Investment Advisors · 182 companies
They all offer customized financial solutions to help clients grow, manage, and protect their wealth through a range of investment vehicles and advisory services.
This group consists of financial firms that specialize in managing investments, offering wealth management services, and providing advisory solutions to individuals and institutions. Their primary customers include high-net-worth individuals, corporations, and institutional investors seeking to grow and preserve their assets. The companies offer products such as separately managed accounts, mutual funds, private equity investments, and financial planning services. Their economics are driven by asset management fees, performance-based compensation, and advisory services, with a focus on long-term client relationships and portfolio growth.
Most representative members
mcap
OPY
Oppenheimer Holdings Inc.
$1.2B
STEP
StepStone Group Inc.
$6.0B
SF
Stifel Financial Corp
$12.6B
JEF
Jefferies Financial Group Inc.
$11.5B
SFB
Stifel Financial Corporation 5.20% Senior Notes due 2047
$2.0B
VRTS
Virtus Investment Partners, Inc.
$1.1B
RWAY
Runway Growth Finance Corp.
$0.3B
VCTR
Victory Capital Holdings, Inc.
$6.8B
All members: AAMI AB ABX ABXL ADAMI ADAML ADAMO ALTI AMBR AMG ANDG APAM APO APOS ARCC ARES AVAL BAM BBDC BCIC BCSF BEN BGC BK BLK BMHL BN BNH BNY BR BRBI BULL BUR BX CG CGABL CGBD CHMI CICC CIMP CION CME CNS CSWC CWAN DBRG DX ECPG ELLA EQH EVR FDUS FHI FRBT FSK GAIN GAING GAINI GAINZ GBDC GCMG GECCG GECCI GEGGL GLAD GS GSBD HCXY HLI HLNE HNNA HOOD HTFC HTGC IBKR ICE IVZ JCAP JEF JHG KBDC KKR LAZ LCLN LIEN LPLA LWAC MAIN MATX MC MCO MFG MFIC MFICL MIAX MITP MLCIL MORN MRX MS MSCI MSIF MTC NCDL NDAQ NLY NMFCZ NMR NOAH NSLRL NTRS OBDC OCSL OPY ORC OTF OWL OXSQH PAX PFG PFLA PFX PFXNZ PIPR PJT PMTU PNNT PRAA PS PSBD PWP RILY RILYG RILYL RILYN RILYP RILYT RILYZ ROMA RPC RWAY RWAYI RWAYL SAGU SAJ SAMG SAR SAT SAV SAZ SCHW SCM SEIC SF SFB SII SLRC SNEX SSNC STEP STT SUPV SWKHL TCPC TOP TPG TPGXL TRIN TRNZ TROO TROW TSLX UBS VALU VCTR VINP VOYA VRTS WHFCL WHG WT XP
Rental Property REITs · 178 companies
These companies all generate revenue by owning and leasing real estate properties, primarily to tenants who require physical spaces for business or living.
This group consists of real estate investment trusts (REITs) that specialize in owning, operating, and leasing residential and commercial properties. Their primary customers include individuals seeking housing and businesses needing physical locations. These companies make money through rental income, often under long-term leases, and sometimes through additional fees or income-sharing agreements. They operate in various property types, including apartments, single-family homes, and commercial spaces, but their core business model is the same: owning real estate and leasing it out for profit.
Most representative members
mcap
BRT
BRT Apartments Corp.
$0.3B
AAT
American Assets Trust, Inc.
$1.4B
LTC
LTC Properties, Inc.
$2.0B
NXRT
NexPoint Residential Trust, Inc.
$0.6B
AMH
American Homes 4 Rent
$12.4B
ARL
American Realty Investors, Inc.
$0.2B
EPRT
Essential Properties Realty Trust, Inc.
$6.6B
CURB
Curbline Properties Corp.
$3.4B
All members: AAT ADAM ADAMG ADC AHR AIRC AIV ALCO ALX AMH APLE ARE ARL ARR AVB AXR BEEP BEKE BFS BHR BNL BPYPP BRSP BRT BRX BXP BZH CAPL CBL CBRE CCS CDP CHCI CIGI COLD CRESY CSGP CSR CTO CTRE CUBE CURB CUZ CWK DEA DEI DFH DHI DLR DOC DOUG EGP ELS EPR EPRT EQR ESRT ESS EXR FCPT FISK FOR FPH FPI FR FRPH FSV FVR GHI GLPI GNL GOODN GOODO GRBK GTY HHC HHH HIW HOV HOVNP HPP HRI HST IIPR INN INVH IOR IRS IRT IVT IX JBGS JLL JOE KBH KIM KRC LANDO LEGH LEN LGIH LPA LTC MAA MAC MAYS MDC MDV MHO MLP MRP MTH NEN NHP NHPBP NLOP NNN NTST NVR NXRT OLP ONL OZ PDM PECO PINE PK PLD PSA PSTL REGCO REXR RITM RMR ROL SAFE SDHC SHO SITC SKT SKY SKYH SLG SMA SMRT SPG SRG STAG STC STHO STRS STRW STWD SUI SUNS TCI TH TMHC TOL TPH TRC TRNO TWO UDR UE UMH URI VAC VICI VTMX VTR WELL WPC WSC XHR XRN Z ZG
Ready-to-Eat Food Distributors · 167 companies
All these companies sell ready-to-eat or ready-to-serve food products to a wide range of commercial and retail customers.
This group consists of companies that distribute or manufacture pre-prepared, packaged, or frozen food items intended for immediate consumption or quick meal preparation. Their customers include restaurants, grocery stores, food service providers, and consumers looking for convenience. These companies solve the problem of time and effort in meal preparation by offering products that are easy to use, store, or serve. Their economics are driven by volume sales, distribution networks, and brand loyalty in the food service and retail sectors.
Most representative members
mcap
USFD
US Foods Holding Corp.
$24.0B
PEP
PepsiCo, Inc.
$189.9B
JJSF
J&J Snack Foods Corp.
$1.7B
MCD
McDonald's Corporation
$195.0B
GIS
General Mills, Inc.
$19.7B
FLO
Flowers Foods, Inc.
$1.6B
KHC
The Kraft Heinz Company
$30.0B
DAR
Darling Ingredients Inc.
$9.4B
All members: ABEV ACB ACI AFRIW AGCC AIIR ARCO ARKO ASAI AVO BDL BG BGS BH BJ BJRI BLMN BRBR BRCB BRCC BRFS BROS BTI BUD BUDA BYND CAG CAKE CALM CASY CAVA CBRL CCEP CCU CELH CGC CHA CHEF CHWY CMG CNNE COCO COKE COST CPB CRON DAR DDL DEO DIN DMC DNUT DOLE DPZ DRI EAT FIZZ FLO FLWS FMX FRPT FWRG GIS GLAS GPK HDL HFFG HLF HRL HSY IFF IMKTA INGR JACK JBS JBSS JJSF JMKE K KDP KHC KO KOF KR KRT KRUS LCUT LMNR LOCO LW LWAY MAMA MB MCD MDLZ MED MFP MGPI MICC MIDD MIDDV MKC MNST MO MOS MUSA MZTI NATH NDLS NGVC NOMD NTR OFRM OGI OI OTLY PEP PFGC PM POST PPC PRMB PTLO PZZA QSR REYN RRGB SAM SBUX SENEA SFD SFM SG SHAK SJM SMPL SNDL STZ SUJA SYY TAP TBBB TLRY TPB TR TRLV TSN TXRH UNFI USFD USNA UTZ UVV VFF VITL VLGEA WEN WEST WILC WING WMK WMT WRK YSWY YUM YUMC ZVIA
Footwear and Apparel Retailers · 165 companies
These companies all sell branded footwear and apparel to consumers, focusing on style, comfort, and functionality for everyday and specialized use.
This group includes retailers and manufacturers that sell a wide range of footwear and apparel products, targeting consumers from different age groups, income levels, and cultural backgrounds. Their products include everything from work boots and athletic shoes to casual wear and designer fashion, often tailored to specific segments like families, young adults, or professionals. These companies generate revenue through retail sales, both online and in physical stores, and often operate under multiple brand names to appeal to diverse customer preferences. Their economics are driven by trends in fashion, consumer spending habits, and the need for durable, stylish, and functional clothing and footwear.
Most representative members
mcap
RCKY
Rocky Brands, Inc.
$0.4B
NKE
NIKE, Inc.
$61.7B
CTRN
Citi Trends, Inc.
$0.6B
SHOE
Shoe Carnival, Inc. Common Stock
$0.4B
DDS
Dillard's, Inc.
$9.6B
SHOO
Steven Madden, Ltd.
$3.6B
PG
The Procter & Gamble Company
$346.5B
CRI
Carter's Inc.
$1.5B
All members: AAPL ACCO AEO AKA ANF ANGI AOUT ARHS AS ASO BARK BBBY BBW BBWI BBY BIRK BKE BNED BOBS BOOT BSET BURL BWMX CAL CENTA CHD CL CLAR CLX CODI COLM COTY CPRI CRCT CRI CROX CTRN CURV DBI DDS DECK DG DIBS DKS DLTH DLTR DRVN EL ELF ELY EPC ESCA ETD ETSY FBIN FERG FIGS FIVE FLXS FND FNKO FOSL FTLF GCO GIII GIL GO GOLF GOOS GPS GRMN HBB HD HELE HNST HOFT HVT IPAR JAKK JILL JOUT JWN KMB KSS KTB KVUE LAKE LANV LE LEVI LOVE LOW LULU LUXE LZB M MAS MAT MBC MBUU MNSO MOV NATR NKE NUS NWL OLLI ONON OSW OXM PBH PG PLBL PLNT PRGO PSMT PTON PTRN PVH RACE RCKY RH RL ROST RVLV SBH SGC SGI SHOE SHOO SIG SKX SLSN SMG SN SPB SVV SWBI SWIM SXT TGT TJX TLYS TPR TSCO UAA UFI UL ULTA URBN VFC VIPS VNCE VRA VSTS VSXY WEYS WHR WINA WSM WWW YSG ZGN ZONE ZUMZ
Aerospace Systems and Components · 162 companies
All companies provide specialized hardware, software, or services that are integral to the operation, safety, and performance of aircraft and aerospace systems.
This group includes companies that produce and supply essential components and systems for the aerospace industry, such as avionics, power systems, flight controls, environmental controls, and unmanned systems. Their customers include aircraft manufacturers, defense contractors, and commercial aviation operators. These companies solve problems related to flight safety, power management, system integration, and mission-critical operations. Their economics are driven by long-term contracts with aerospace OEMs and government defense agencies, with high margins due to the technical complexity and specialized nature of their products.
Most representative members
mcap
HON
Honeywell International Inc.
$78.0B
HONA
Honeywell Aerospace Inc
$53.4B
ETN
Eaton Corporation plc
$174.2B
RTX
RTX Corporation
$300.6B
GD
General Dynamics Corporation
$106.1B
DCO
Ducommun Incorporated
$3.0B
AVAV
AeroVironment, Inc.
$9.5B
HWM
Howmet Aerospace Inc.
$112.8B
All members: AADX ABM ACHR AIR AIRO AIRT AIT ALLE ALNT ALOT ALSN ALV AME APH ARXS ASLE ATI ATRO AVAV AVEX AXON BA BB BELFB BETA BLBD BWXT BYRN CAE CCIV CDRE CIX CODA CR CRSR CTS CW CYRX DCO DPRO DRS DSGR EH ELMT ELVA EMR ESE ESLT ESP ETN EVEX EVLV EVTL FJET FLY FTAI FTV GD GE HEI HII HLIO HMC HON HONA HOVR HOVRW HUHU HWM HXL IESC IR ITRI ITRN ITT JOBY KBR KEYS KRMN KTOS LDOS LFUS LHX LMT LOAR LUNR LVWR MIR MOBBW MPTI MRCY MSA NL NNBR NOC NPO NSSC NVT OII ONDS OPXS OSIS OSK OTIS PCOR PEW PH PKE PLXS PSN RAL RBC RCAT RDW RELL REZI RGR RKLB ROG ROK RRX RTX RXN SARO SATL SEE SERV SIDU SIF SPAI SPCX SPIR SPR SPXC SRFM SRI SRJN ST STRT SWMR SXI TATT TAYD TDG TDY TEL TM TRNS TWIN TXT ULBI UMAC VNT VOYG VPG VRRM VSEC VVX WAB WRAP WWD YSS
These companies all provide infrastructure systems and services that maintain the flow, distribution, and management of essential resources like water, waste, and energy.
This group consists of companies that design, install, and maintain critical infrastructure systems for water, wastewater, and energy utilities. Their customers include municipalities, contractors, and industrial clients who need reliable infrastructure to manage water distribution, waste disposal, and energy transportation. They solve problems related to resource flow, system reliability, and environmental compliance. Their business model is largely based on long-term contracts, maintenance services, and infrastructure upgrades.
Most representative members
mcap
WTRG
Essential Utilities, Inc.
$11.4B
WTTR
Select Water Solutions, Inc.
$2.2B
WTS
Watts Water Technologies, Inc.
$13.1B
AWK
American Water Works Company, Inc.
$26.9B
ENB
Enbridge Inc.
$112.0B
WCN
Waste Connections, Inc.
$42.0B
FIX
Comfort Systems USA, Inc.
$59.6B
FET
Forum Energy Technologies, Inc.
$0.8B
All members: ACA ACM ADUR AESI ALTG AM AMSC AOS AROC ARTNA AWK AWR BBCP BBUC BIP BIPC BIPH BIPI BKR BMI BW BWEN BWMN CDNL CDZI CECO CLB CLH CNM CTOS CTRI CVEO CWCO CWST CWT DKL DNOW DTI DTM DWSN DXPE ECG ECVT EE EFXT EME ENB EPAC EQPT EQT ERII EROK ESOA EVI FELE FET FIP FIX FLNC FLOC FLR FLS FTI FTK GFLU GFR GRC GTLS GVA GWRS HAL HAYW HLX HP HTO HWKN INVX KGS KNF LB LBRT LMB LNN LQDT LSE MG MSEX MTRX MTZ MWA MYRG NBR NCSM NE NESR NGS NINE NOA NOV NVRI NWPX OIS OMSE ONEW ONT ORN PCYO PDS PESI PHOE PNR POOL PPIH PRIM PTEN PUMP PWR RES RMIX RNGR RSG SBS SHIM SLB SMC SND SOBO SR STN STRL SWX TAC TIC TISI TPC TTEK TTI TUSK USAC VRT WAT WBI WCN WFRD WHD WLDN WM WMS WTRG WTS WTTR WWR XPRO XYL YORW ZWS
Precious Metal Miners · 156 companies
These companies all derive revenue from the extraction and sale of precious and base metals, primarily targeting bullion markets, refiners, and industrial buyers.
This group consists of mining companies that extract and sell gold, silver, and other metals like copper, zinc, and lead from their mines. Their primary customers include bullion investors, financial institutions, jewelry manufacturers, and metal refiners. These companies operate in various regions and often focus on both precious and base metals, depending on the mineral deposits they have access to. Their economics are driven by the fluctuating prices of metals on global markets and the efficiency of their mining and processing operations.
Most representative members
mcap
AGI
Alamos Gold Inc.
$13.9B
PAAS
Pan American Silver Corp.
$21.6B
KGC
Kinross Gold Corporation
$32.8B
USAU
U.S. Gold Corp.
$0.3B
GORO
Gold Resource Corporation
$0.2B
CDE
Coeur Mining, Inc.
$17.9B
AUGO
Aura Minerals
$6.2B
SCZM
Santacruz Silver Mining Ltd.
$0.8B
All members: AA AAUC AEC AEM AG AGI ALM AMBP AMR AREC ARLP ARMN ASM ATLX AU AUGO B BHP BMM BRLT BSM BTG BVN CCJ CDE CENX CGAU CMCL CNL CNR CRML CTGO DC DMLP DNN DRD EGO ELE ELVR EMAT EQX ERO EU EXK FCX FNV FSM FURY GAU GFI GLDG GMTL GORO GRO GROY GRSVU HBM HCC HL HMY HSLV HYMC IAG IAUX ICL IDR IE IMC IONR IPI ISOU ITRG KGC LAC LAR LEU LOMA LXU LZM MAKO METC MINE MP MTA MTAL MUX NAK NB NC NEM NEWP NEXA NEXM NFGC NG NGD NICM NMG NUCL NVA NXE OGG OR ORLA PAAS PLG PPTA PZG REA RGLD RIO SA SAND SBMT SBSW SCCO SCZM SGML SID SIND SKE SLI SLSR SQM SRL SSMR SSRM SVM SXC TECK TFPM TGB THM TII TMCR TMQ TROX TRX UAMY UAN UEC UROY USAR USAS USAU USGO USLM UUUU VALE VGZ VMET VOXR VZLA WPM WRN YDDL
Community Bank Lenders · 142 companies
They all offer traditional banking services with a focus on local markets, emphasizing commercial and consumer lending.
This group consists of regional and community banks that primarily serve small businesses and individual consumers with a range of financial products. They offer checking and savings accounts, time deposits, and a variety of loan products such as commercial and industrial loans, real estate loans, and working capital financing. Their target customers include local businesses, entrepreneurs, and individuals seeking short- and long-term financing. The economics of these banks rely on interest income from loans and fees from deposit services, with a strong emphasis on community relationships and local market presence.
These companies all generate revenue by extracting and selling fossil fuels, primarily oil and natural gas, to refineries, industrial users, and energy markets.
This group consists of companies that explore, develop, and produce oil, natural gas, and natural gas liquids (NGLs) from onshore and offshore reserves. Their primary customers include refineries, petrochemical plants, and other energy companies that use these raw materials for fuel, manufacturing, and energy generation. These companies operate in major oil and gas basins across the United States and globally, and their economics are driven by the price of crude oil and natural gas, as well as the demand for energy in both industrial and consumer markets.
Most representative members
mcap
EXEEW
Expand Energy Corporation
$24.5B
WTI
W&T Offshore, Inc.
$0.5B
WMB
The Williams Companies, Inc.
$86.1B
DVN
Devon Energy Corporation
$30.1B
FANG
Diamondback Energy, Inc.
$52.9B
CVX
Chevron Corporation
$371.6B
MUR
Murphy Oil Corporation
$4.8B
NOG
Northern Oil and Gas, Inc.
$2.3B
All members: AGRO AMPY AMTX ANDE ANNA APA APC AR ATO BCEI BKV BP BTE BTU CHRD CHSCM CLNE CNQ CNX COP CPG CQP CRC CRGY CRK CSAN CTRA CVE CVI CVX DEC DINO DK DVN E EGY EOG EP EPD EPM EPSN EQNR ET EXEEW FANG GEL GEVO GLNG GLP GPOR GPRE GPRK GRNT GTE HES HESM HPK IMO INR KGEI KMI KNTK KOS KRP LND LNG LTBR MEOH MGY MMLP MNR MNTK MPC MPLX MTDR MUR NEXT NFG NGL NOG NRP NUAI NWN OBE OGS OKE OVV OXY PAA PAGP PAM PARR PBA PBF PBR PED PNRG PR PROP PSX REI REPX REX RGCO RRC SAFX SD SGU SHEL SLNG SM SOC SPH SSL SU TALO TBN TCPA TGS TPL TRGP TRP TS TTE TXO UGI URG VET VG VIST VLO VNOM VRN VTS WDS WES WHK WLKP WMB WTI XOM YPF
Maritime Freight Transporters · 134 companies
All companies specialize in the transportation of goods via maritime or overland freight, focusing on large-scale, specialized cargo.
This group consists of companies that operate in the freight and shipping industries, transporting commodities like crude oil, refined petroleum, dry bulk goods (coal, grain, iron ore), and other industrial materials. Their primary customers are industrial clients, trading houses, and large corporations that need reliable and efficient transportation of goods over long distances. These companies solve the problem of moving large volumes of goods across global supply chains, often using specialized vessels like tankers, dry bulk carriers, and containerships. Their business model is based on leasing or operating fleets and charging for transportation services, with revenue dependent on global trade demand and shipping rates.
Most representative members
mcap
INSW
International Seaways, Inc.
$4.6B
IMPPP
Imperial Petroleum Inc.
$0.2B
PANL
Pangaea Logistics Solutions, Ltd.
$0.5B
SFL
SFL Corporation Ltd
$1.6B
UNP
Union Pacific Corporation
$174.1B
LSTR
Landstar System, Inc.
$6.2B
CVLG
Covenant Logistics Group, Inc.
$0.9B
MRTN
Marten Transport, Ltd.
$1.2B
All members: AAL AER AERO AL ALGT ALK ARCB ASC ASR ATCOL BC BORR BWLP CAAP CAR CCEC CCL CDLR CHRW CMBT CMDB CMRE CNI CP CPA CSX CVLG DAC DAL DHT DLNG DSGX DSX ECO EDRY ENRD ESEA EXPD FDX FDXF FER FLNG FRO FWRD GASS GATX GBX GNK GSL GXO HAFN HSHP HTLD HTZWW HUBG HZO IMPPP INSW JBHT KEX KNOP KNX LIND LINE LPG LSTR LTM LUV MCFT MRTN NAT NCLH NMM NSC NVGS ODFL OMAB PAC PAG PAL PAMT PANL PCAR R RCL RIG RJET RLGT RUSHB RXO RYAAY SAIA SB SBLK SDRL SEB SFL SHIP SKYW SMHI SNDR SPCE STNG SUN SUNB SUNC TDW TEN TFII TK TNK TORO TRMD TRTN UAL UGP UHAL ULCC ULH UNP UP UPS VAL VIK VLRS VTOL WERN WKC WLFC WNC XPO YMM ZIM ZTO
Electricity Distributors and Generators · 133 companies
They all provide electricity generation and distribution services to end-users, primarily through traditional power sources like coal, natural gas, and nuclear.
This group consists of utility companies that generate electricity using a combination of coal, natural gas, and nuclear power, and distribute it to millions of customers in specific regions. Their primary customers are residential households, small businesses, and large industrial users who rely on a stable and continuous electricity supply. These companies operate in a regulated environment, often with monopoly-like control over their service areas, and their economics are driven by long-term infrastructure investments, regulated rates, and the need to maintain grid reliability. They also increasingly incorporate renewable energy sources as part of their generation mix.
Most representative members
mcap
DTW
DTE Energy Company JR SUB DB 2017 E
$29.3B
XELLL
Xcel Energy Inc. 6.25% Junior Subordinated Notes, Series due 2085
$14.1B
DTE
DTE Energy Company
$29.1B
SO
The Southern Company
$106.6B
GPJA
Georgia Power Company 5% JR SUB NT 77
$0.2B
DTB
DTE Energy Company 2020 Series
$3.4B
DTK
DTE Energy Company 2025 Series
$4.9B
CMSD
CMS Energy Corporation 5.875% Junior Subordinated Notes due 2079
$6.7B
All members: ADSE AEE AEP AESC AGX AMRC AQNA AQNB AVA AXIA BE BEP BEPC BKH BLNK CEG CEPL CEPU CIG CMS CMSA CMSC CMSD CNP CPK CSIQ CWEN D DTB DTE DTG DTJ DTK DTW DUK DUKB EAI EC ED EDN EIX ELC ELLO ELP ELPC EMA EMP ENIC ENJ ENLT ENPH ENS EOSE EROC ES ETR EVGO EVRG EXC FCEL FE FISN FPS FRMI FRVO FTS GEV GNE GNRC GPJA HASI HE HNRG HYLN IDA IMSR KEN KEP LNT MDU MGEE NEE NEOV NFE NGG NI NIMC NJR NKLR NNE NPWR NRG NRGV NWE OESX OGE OKLO ORA PCG PEG PLUG PNW POR PPL PPLC RNW RUN SEDG SEI SHLS SLDPW SMR SO SOJC SOJE SOMN SRE TE TGEN THCBU TLN TOYO TSLA TXNM TYGO UTL VST WATT WEC XE XEL XELLL XIFR
Insurance Risk Mitigators · 130 companies
These companies all provide financial protection through insurance and reinsurance products, helping clients manage and transfer risk.
This group consists of companies that specialize in offering insurance and reinsurance products to individuals and businesses, covering a wide range of risks such as property damage, liability, health, and life. Their primary customers include consumers, small businesses, and large corporations seeking to mitigate financial exposure from unforeseen events. The economics of the group are driven by premium collection, risk pooling, and claims management, with profitability dependent on accurate risk assessment and underwriting. These companies operate in a highly regulated environment and often serve niche markets or provide specialized coverage in areas like professional liability, property, and annuities.
Most representative members
mcap
HIG
The Hartford Insurance Group, Inc.
$39.3B
AXS
AXIS Capital Holdings Limited
$7.6B
CNO
CNO Financial Group, Inc.
$5.1B
IGIC
International General Insurance Holdings Ltd.
$1.2B
THG
The Hanover Insurance Group, Inc.
$8.0B
WTM
White Mountains Insurance Group, Ltd.
$5.3B
BNT
Brookfield Wealth Solutions Ltd.
$14.8B
CINF
Cincinnati Financial Corporation
$27.1B
All members: ACGL ACGLO ACIC ACT AEB AEG AEH AEL AFG AFL AGO AIFU AIG AII AIZ AIZN AJG ALL AMSF AON APG ARX ASIC ATH ATHS AXS BHFAO BNT BOW BRO BWIN CB CBZ CIA CINF CNA CNO CRBG CSV CWH DGICB EG EIG ERIE ESGRP ESNT EVER FGN FNF FTDR GBLI GL GLRE GNW GSHD GWRE HCI HG HGTY HIG HIPO HMN HRTG IGIC ITIC JRVR JXN KINS KMPB KMPR KNSL KWY L LIFE LMND LNC MAAS MBI MCY MET MFC MHLA MKL MRSH MTG NMIH NODK NP ORI OSG PFH PGR PLGO PLMR PRCH PRH PRHIZ PRI PRS PRU PUK RDN RGA RLI RNR ROOT RYAN SAFT SDA SIGI SKWD SLDE SLF SLQT SNFCA SPNT THG TIPT TRV TWFG UFCS UNM UNMA UVE VRSK WRB WTM WTW XZO YB
SPAC Vehicles · 129 companies
These companies are all SPACs designed to raise capital for future acquisitions rather than operating businesses themselves.
This group consists of Special Purpose Acquisition Companies (SPACs) that do not currently sell products or services. Instead, they are publicly traded vehicles formed to merge with or acquire existing businesses. Their primary function is to raise funds from investors to later invest in a target company, typically through a merger or share exchange. These companies have no operations of their own and generate no revenue until they complete a business combination, at which point they may transition into operating companies.
All companies provide healthcare services rather than physical products, targeting individuals, employers, or health plans with solutions for medical care, wellness, and health management.
This group includes companies that operate in the healthcare services sector, offering everything from hospital care and pharmacy solutions to telehealth and occupational health. Their primary customers are patients, employers, health plans, and healthcare facilities. These companies solve problems related to access to care, treatment of medical conditions, and health management through a variety of service models, including staffing, insurance, and digital health platforms. Their economics are driven by service contracts, insurance plans, and recurring subscriptions rather than product sales.
Most representative members
mcap
UHS
Universal Health Services, Inc.
$10.5B
CVS
CVS Health Corp.
$122.1B
AMN
AMN Healthcare Services, Inc.
$1.4B
ASTH
Astrana Health, Inc.
$1.8B
CON
Concentra Group Holdings Parent, Inc.
$4.4B
BTSGU
BrightSpring Health Services, Inc. Tangible Equity Unit
Wireless and Broadband Connectivity Providers · 102 companies
These companies all provide connectivity solutions, focusing on delivering reliable internet and mobile services to households and businesses.
This group includes companies that offer wireless and broadband services to consumers and businesses, solving the problem of access to high-speed internet and mobile communication. Their primary customers are residential users and small to large businesses that require reliable connectivity for daily operations, entertainment, and communication. These companies generate revenue through subscription-based models, selling data plans, internet access, and related devices. They compete in a rapidly evolving market driven by increasing demand for digital services and remote connectivity.
Most representative members
mcap
TBC
AT&T Inc. 5.625% Global Notes d
$179.8B
T
AT&T Inc.
$163.1B
TBB
AT&T Inc. 5.35% GLB NTS 66
$160.4B
CCZ
Comcast Holdings Corp.
$15.9B
OPTU
Optimum Communications, Inc.
$0.4B
VZ
Verizon Communications Inc.
$196.5B
ITG
ITG Inc.
$1.7B
LUMN
Lumen Technologies, Inc.
$6.4B
All members: AD ADEA ADTN AMT AMX ARLO ASTS ATEX ATNI AVNW BCE BDC BKTI CABO CCI CCOI CCZ CHT CHTR CIEN CLFD CMCSA COMM CRNT CSCO CTBB CTDD CTGG CTHH DGII DY ERIC EVC FLEX FYBR GILT GLIBA GOGO GSAT HLIT HUBB IDCC IDT IHS INSG IRDM ITG KT KVHI KYIV LBRDA LBTYB LBYKV LILA LILAP LUMN NOK NTGR OCC OPTU PHI PLUS RBBN RCI RDCM RFIL RNG SATS SBAC SBGI SHEN SKM SNRE SONO SPOK T TBB TBC TCX TDS TEO TIGO TIMB TKC TLK TMUS TSAT TU TV UI UNIT USM UZD UZF VEON VISN VIV VOD VSAT VZ WCC XPER
Bitcoin Mining Infrastructure · 73 companies
All companies offer tools, services, or infrastructure directly related to the process of Bitcoin mining.
This group consists of companies that enable or facilitate Bitcoin mining through specialized hardware, cloud mining services, or infrastructure support. Their primary customers include individual miners, institutional investors, and mining pool operators who seek to validate transactions on the Bitcoin network and earn block rewards. The economics of the group are tied to the fluctuating value of Bitcoin and the efficiency of mining hardware. These companies monetize the demand for scalable, reliable, and cost-effective mining solutions in a highly competitive and energy-intensive industry.
Most representative members
mcap
FUFUW
BitFuFu Inc.
$0.2B
IREN
IREN Limited
$14.7B
WULF
TeraWulf Inc.
$8.5B
IOND
Ionic Digital Inc. Class A
$2.4B
BTBT
Bit Digital, Inc.
$0.5B
BTGO
BitGo Holdings, Inc.
$0.5B
CSHR
CoinShares PLC Ordinary Shares
$0.3B
ABTC
American Bitcoin Corp
$0.5B
All members: ABTC AGPU AIAI AIB ANTA APLD ASST BGIN BKKT BLSH BMNR BNC BRR BRUN BTBT BTDR BTGO BTQ BZAI CAN CD CIFR CLSKW CNCK COIN CORZ CRCL CSHR DEFT DFDV DGXX DJT DTCX EMPD ETOR EXOD FGNXP FIGR FRMM FUFUW GDS GEMI GLXY HIVE HUT IKNX IOND IREN KEEL KULR MARA MSTR NA NAKA ORBS PGY PURR QMLS RIOT SATA SBET SECZ SHAZ SLNHP STEX STRF TIGR TONX USBC WULF WYFI XYZ ZTG
Honest limitations
Emergent doesn't mean true: k-means draws hard borders through soft space, and
conglomerates get placed by their dominant product line. The labeler is a 14B
local model reading 12 members per cluster — evocative, not authoritative.
Descriptions are a snapshot (September 02, 2026); companies drift. And the corpus covers US-listed
companies above $75M market cap with a recent annual filing — 4,560 of them.
Everything here was produced by the open-source
FNTK Pro Local stack:
local LLM, local embeddings, one GPU, two data keys.