We pulled FINRA short interest for the whole market from the
Massive API, defined "heavily shorted" relative to company size, and painted it
over the product-similarity map. The bears, it turns out, hunt in packs —
in a few very specific product neighborhoods.
settlement 2026-08-14 · 4,194 companies scored
· 423 flagged high · ← back to the Atlas
Step 1
Two API calls, the whole market
FINRA publishes short interest twice a month. The Massive API serves the full
settlement in one paginated call; a grouped-daily call for our market-cap
snapshot date gives every close, which turns raw shares-short into a percentage
of shares outstanding:
# One call: FINRA short interest for the entire market, latest settlement
GET https://api.massive.com/stocks/v1/short-interest
    ?settlement_date=2026-08-14&limit=50000        # -> 22,480 rows

# One more call: every ticker's close for the market-cap snapshot date,
# so shares outstanding = market_cap / close is date-consistent
GET https://api.massive.com/v2/aggs/grouped/locale/us/market/stocks/2026-08-10

si_pct = short_interest / (market_cap / close) * 100
Joining against the Atlas corpus scored 4,194 of the 4,560 mapped
companies (the rest lacked a clean short-interest record or same-date close).
Step 2
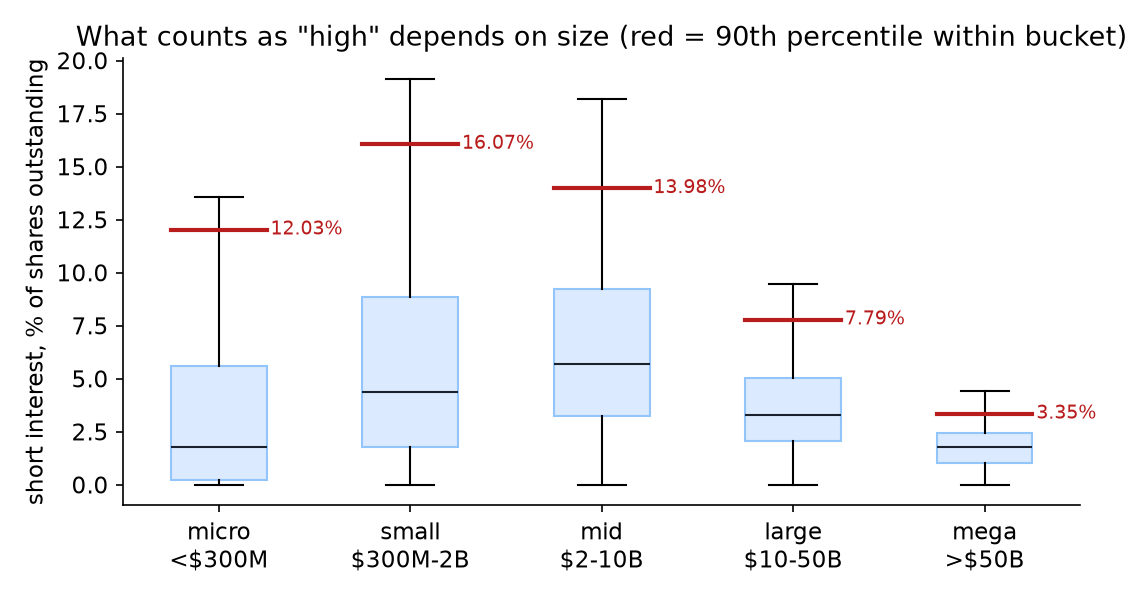
"High" depends on how big you are
5% short interest in a mega cap is a loud statement — that's billions
of dollars betting against a liquid, well-covered name. 5% in a micro cap is
Tuesday. So instead of one threshold we bucket by market cap and call a company
HIGH only if it clears the 90th percentile of its own bucket:
# "High" is relative to size: a company is HIGH if it clears the 90th
# percentile of ITS market-cap bucket - the threshold is a range, not a number
for bucket in ["micro", "small", "mid", "large", "mega"]:
    high_at[bucket] = np.percentile(si_pct[in_bucket], 90)
The resulting range: "high" starts at 3.35%
for mega caps and 16.07% for small caps.
bucket
companies
median SI%
p75
high at (p90)
micro<$300M
782
1.79%
5.58%
12.03%
small$300M–2B
1314
4.36%
8.84%
16.07%
mid$2–10B
1136
5.71%
9.23%
13.98%
large$10–50B
632
3.29%
5.05%
7.79%
mega>$50B
330
1.76%
2.44%
3.35%
Note the wrinkle: micro caps top out lower than small caps
(12.03% vs 16.07%)
— below ~$300M there's often no stock borrow available, so measured short
interest understates bearishness. The bucket-relative cut absorbs that too.
Step 3
Density, not dots
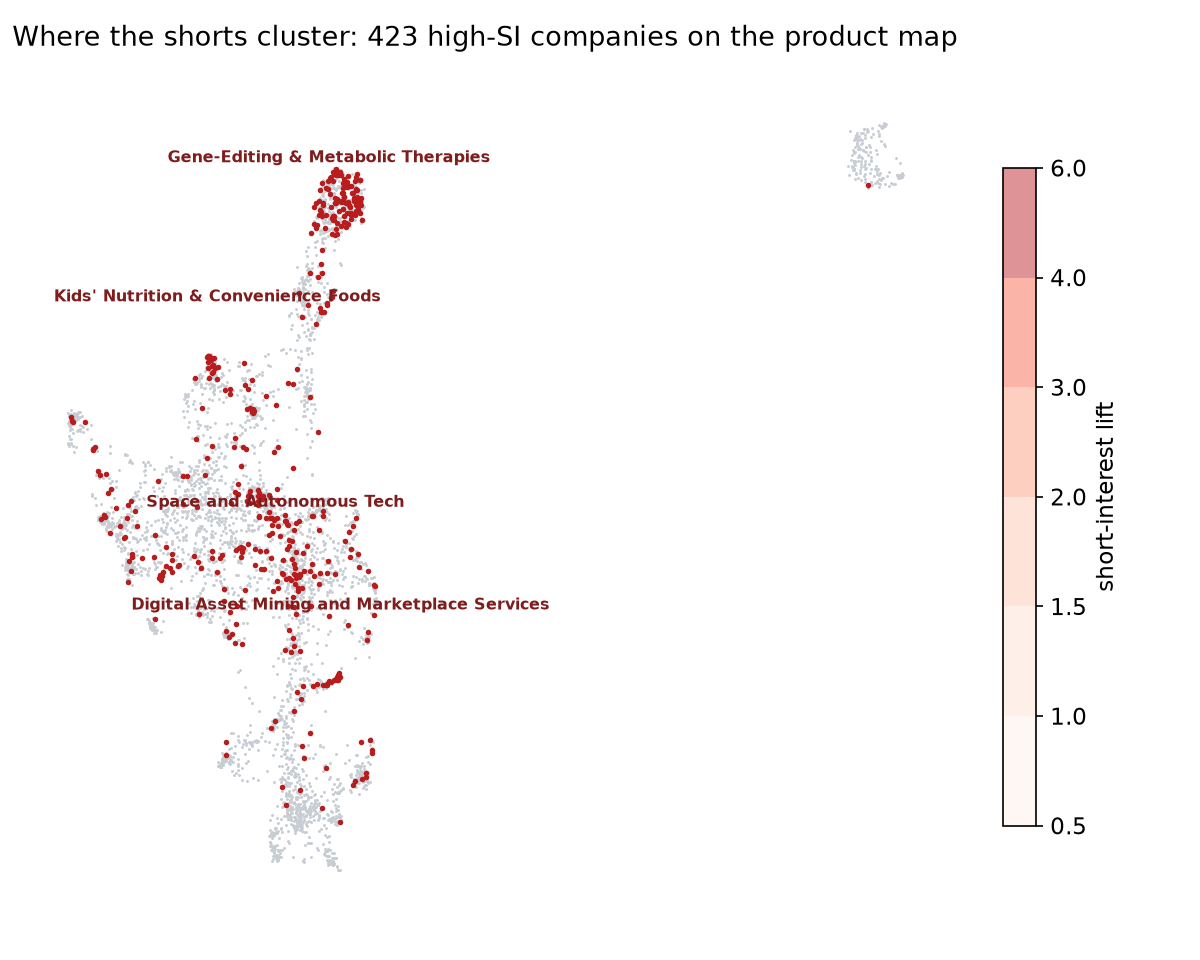
A dot map of 423 shorted companies mostly shows where companies are.
The interesting question is where shorts are over-represented — so we
smooth both populations and take the ratio:
# Density LIFT over the UMAP map: where are high-SI companies
# over-represented relative to how crowded the map is there?
Z_high = gaussian_smooth(coords[high])     # density of high-SI companies
Z_all  = gaussian_smooth(coords)           # density of everyone
lift   = Z_high / np.maximum(Z_all, floor) # >1 = disproportionately shorted
Lift > 1 = more high-SI companies than the neighborhood's crowding
explains. The map's bears concentrate in a few product families.
The map
Explore it
Red dots are high-SI companies (bucket-relative); contours show lift. Hover
any dot for ticker, short interest, and its Atlas cluster.
The hotspots
Where the bears hunt in packs
Peaks in the lift surface, merged into regions, members pulled from the
corpus and named by the local LLM (sector labels banned, as always):
Investors may be skeptical about the high costs, regulatory hurdles, and clinical trial risks associated with gene-editing and metabolic disease treatments, which could delay or prevent commercial success.
Atlas clusters here: Rare Disease Therapies (374), Medical Device Innovators (13), Healthcare Service Providers (4)
Most-shorted members
SI%
size
NEO
NeoGenomics, Inc.
62.02%
small
ALT
Altimmune, Inc.
57.19%
micro
NTLA
Intellia Therapeutics, Inc.
40.26%
small
IMRX
Immuneering Corporation
39.92%
micro
SGMT
Sagimet Biosciences Inc.
38.08%
micro
LENZ
LENZ Therapeutics, Inc.
35.71%
micro
TNGX
Tango Therapeutics, Inc.
35.47%
mid
RXRX
Recursion Pharmaceuticals, Inc.
34.65%
small
IPSC
Century Therapeutics, Inc.
33.59%
micro
REPL
Replimune Group, Inc.
33.54%
small
EVMN
Evommune, Inc.
33.14%
micro
OCGN
Ocugen, Inc.
30.71%
small
2. Space and Autonomous Tech
· 18 high-SI companies · peak lift 0.18×
Investors may be skeptical about the long-term viability of niche aerospace and autonomous systems due to high costs, regulatory hurdles, and uncertain market adoption.
Atlas clusters here: AI-Driven Enterprise Solutions (92), Semiconductor Test and Manufacturing Equipment (58), Aerospace Systems and Components (23)
Most-shorted members
SI%
size
SIDU
Sidus Space, Inc.
70.64%
micro
ONDS
Ondas Holdings Inc.
41.34%
mid
WOLF
Wolfspeed Inc.
41.16%
small
SOUN
SoundHound AI, Inc.
34.71%
mid
SERV
Serve Robotics Inc.
33.97%
small
AI
C3.ai, Inc.
32.24%
small
SPCE
Virgin Galactic Holdings, Inc.
31.55%
small
QMCO
Quantum Corporation
31.38%
micro
RCAT
Red Cat Holdings, Inc.
30.59%
small
BBAI
BigBear.ai Holdings, Inc.
30.15%
small
XRX
Xerox Holdings Corporation
30.03%
small
INDI
indie Semiconductor, Inc.
29.59%
small
3. Digital Asset Mining and Marketplace Services
· 12 high-SI companies · peak lift 0.34×
Investors may be betting that declining cryptocurrency prices and rising energy costs will reduce profitability for companies reliant on digital asset mining and discount-based marketplaces.
Atlas clusters here: Bitcoin Mining Infrastructure (40), Entertainment and Leisure Platforms (6), Healthcare Service Providers (2)
Investors may be betting that demand for premium baby and kids' food products is oversold, with potential for margin compression due to rising ingredient costs or shifting consumer preferences.
Educational example built on public FINRA settlement data
(2026-08-14) and the Atlas embedding corpus. Short interest percentages
use market-cap-derived shares outstanding and can differ from float-based
figures. Not investment advice.