Companies that grew revenue fast — or were priced as if they
would — and whose stocks still went nowhere over one, three, or five years.
The market's broken growth promises, measured two ways and painted on the
product map.
3,811 companies scored · windows since
2025-08-22 / 2023-08-25 / 2021-08-27
· ← back to the Atlas
Step 1
Returns for every listed company, four API calls
Grouped-daily aggregates give the whole market's adjusted closes for any
date, so 1Y/3Y/5Y total returns for all 3,811 mapped companies need no
per-ticker loop:
# Whole-market adjusted closes for 4 dates = 4 API calls, no ticker loop
for d in [today, today-1y, today-3y, today-5y]:
    GET /v2/aggs/grouped/locale/us/market/stocks/{d}?adjusted=true
ret[w] = close_now / close_start - 1        # per ticker, per window
Step 2
Two ways to say "was supposed to grow"
"Underperformed expectations" needs an expectations measure. We use two,
both computable from filings and prices — no analyst-estimate feed:
# "The market expected fast growth" is not a guess - it's a price.
# Starting P/S, with period-correct share counts so dilution can't fake it:
ps_start = shares_basic(FY at window start) * close(window start) / revenue(FY)
expected_fast = ps_start >= corpus_75th_percentile(ps_start)   # top quartile

# "The business actually grew fast" is realized delivery:
grew_fast = revenue_cagr(window) >= 0.15                       # 15%/yr
The starting revenue multiple is the market's growth forecast,
crystallized in a price: nobody pays 4.08× sales (this
corpus's 3Y-window top-quartile cut) for a business they expect to plod.
Revenue history comes from XBRL financials for US filers with an income-statement
fallback for 20-F foreign filers, and share counts come from the same fiscal-year
statements — so a company that doubled its share count can't sneak a high
starting multiple past the math.
Step 3
The screen
# The screen: the stock went nowhere while either promise was live
flag = ret <= 0 and (grew_fast or expected_fast)
cohort = "delivered but de-rated"        if grew_fast else \
         "priced for growth that never came"   # high P/S, growth missed
compression = ps_now / ps_start          # how much the multiple was cut
Every flagged company lands in one of two cohorts, and they mean opposite
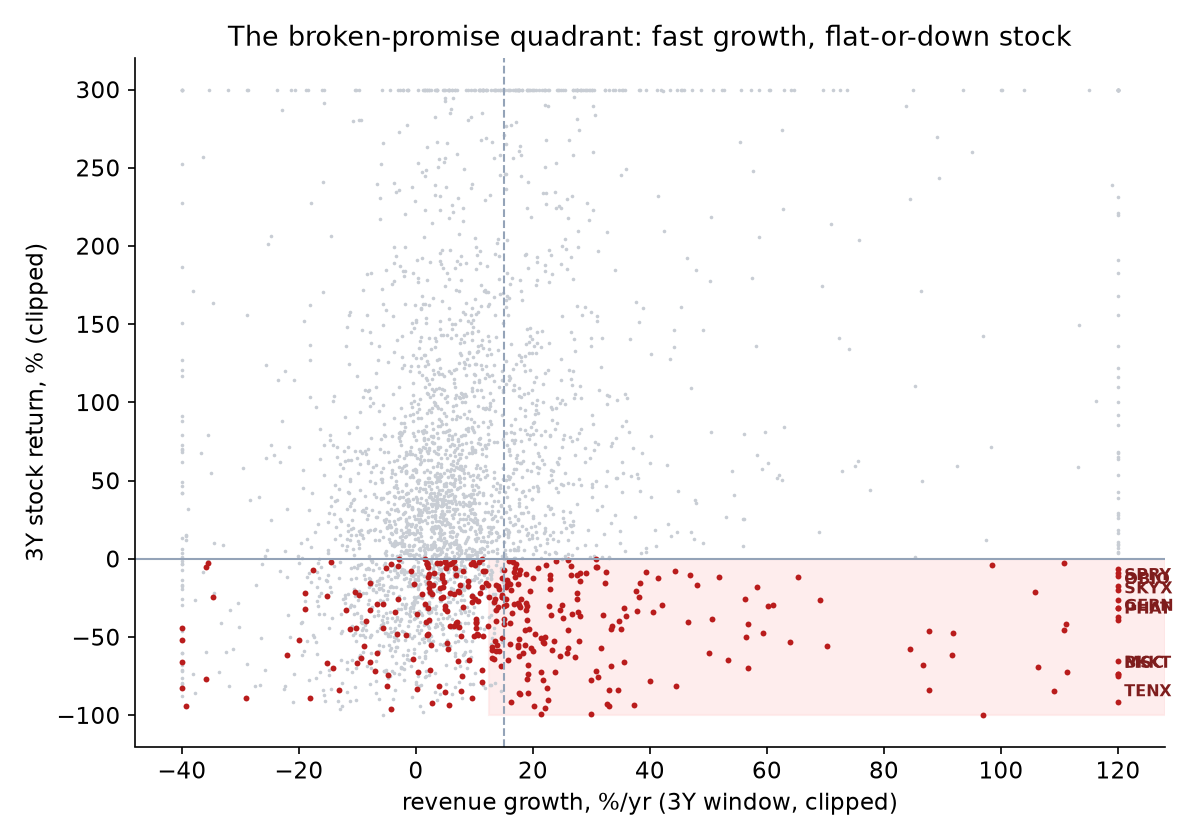
things: "delivered but de-rated" grew ≥15%/yr while the stock went
nowhere — pure multiple compression, the growth promise kept but repriced.
"Priced for growth that never came" started in the top P/S quartile and
missed — the promise itself broke.
window
"expected fast" = P/S ≥
delivered but de-rated
never came
total flagged
1Ysince 2025-08-22
4.48× sales
369
195
564
3Ysince 2023-08-25
4.08× sales
181
174
355
5Ysince 2021-08-27
5.66× sales
327
224
551
The broken-promise quadrant (3Y): right of the dashed line = grew
≥15%/yr; below zero = stock flat or down. Red = flagged.
Step 4
Where the de-rating concentrates
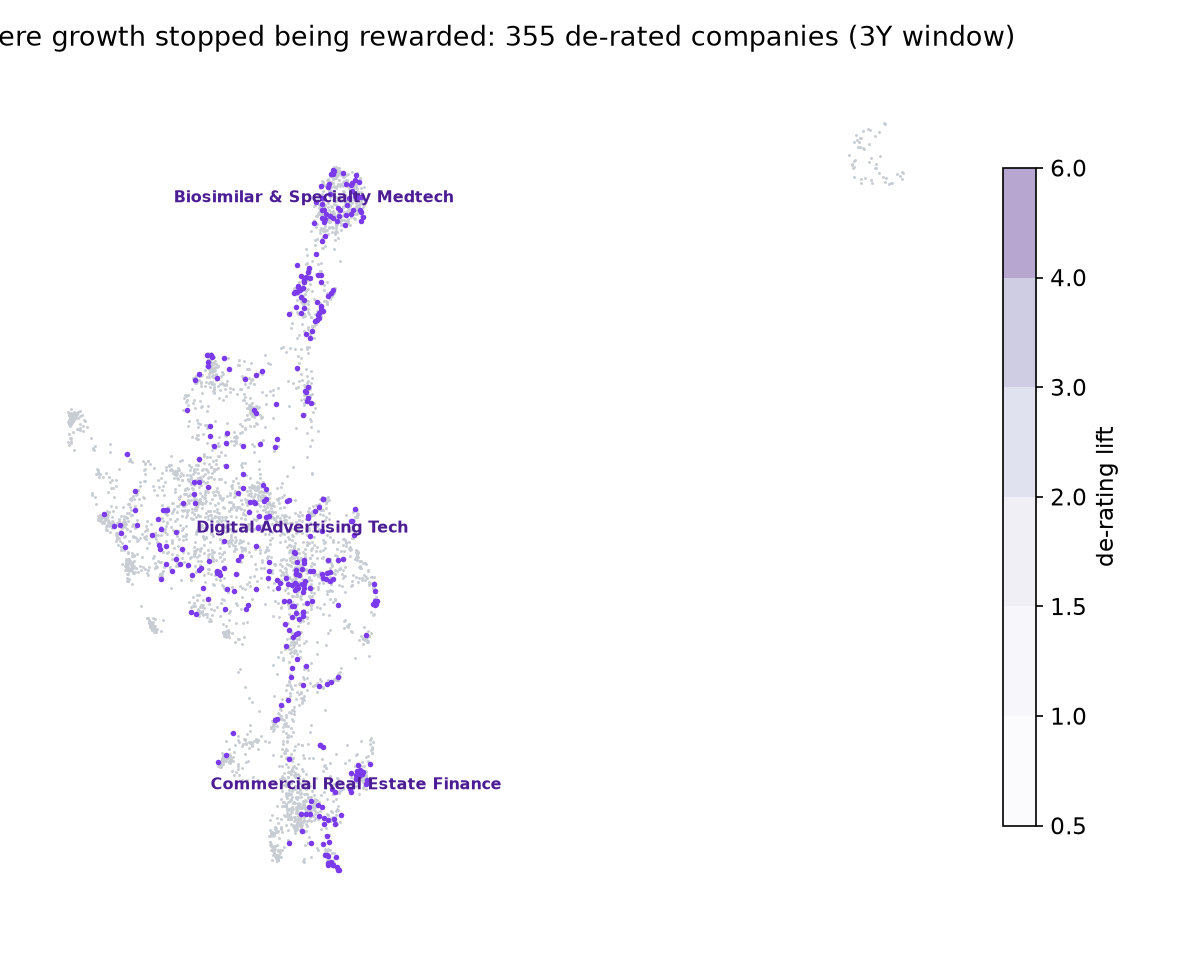
Same density-lift method as the short-interest study: smoothed density of
flagged companies over the map, divided by density of everyone.
De-rated companies aren't sprinkled randomly — the market
repriced whole product families at once.
The map
Explore it
Toggle the window; purple dots are flagged for that window. Hover for
return, growth, starting multiple, and compression. Cohort filter narrows the
ranking table below.
The ranking: most compressed first
Flagged companies for the selected window, sorted by how hard the multiple
was cut (P/S now vs start where computable):
#
ticker
company
Atlas cluster
return
rev growth
start P/S
compression
cohort
The hotspots
Product families the market gave up on (3Y window)
The market may have cut multiples due to saturation, regulatory scrutiny, or shifting ad spend toward emerging platforms and formats, despite growth in revenue.
Atlas clusters here: AI-Driven Enterprise Solutions (41), Digital Payment Facilitators (15), Entertainment and Leisure Platforms (7)
The market may have discounted these companies due to regulatory risks, pricing pressures, or slower-than-expected adoption of their innovative products despite revenue growth.
Atlas clusters here: Medical Device Innovators (43), Rare Disease Therapies (26), Healthcare Service Providers (4)
The market may have cut multiples due to heightened risk aversion toward real estate debt and uncertainty over future cash flows amid economic slowdowns or interest rate hikes.
Atlas clusters here: Rental Property REITs (26), Wealth Management and Investment Advisors (16), Regional Commercial and Residential Lenders (11)
Members (3Y window)
return
rev growth
P/S now vs start
growth
CSGP
CoStar Group, Inc.
-59%
14%/yr
0.26x
never came
SCM
Stellus Capital Investment Corporation
-38%
51%/yr
0.26x
delivered
SITC
SITE Centers Corp.
-94%
-39%/yr
0.27x
never came
CMTG
Claros Mortgage Trust, Inc.
-84%
-13%/yr
0.28x
never came
ARE
Alexandria Real Estate Equities, Inc.
-54%
5%/yr
0.40x
never came
TCPC
BlackRock TCP Capital Corp.
-66%
7%/yr
0.40x
never came
FSK
FS KKR Capital Corp.
-40%
-9%/yr
0.40x
never came
AIV
Apartment Investment and Management Company
-67%
-10%/yr
0.45x
never came
NMFC
New Mountain Finance Corporation
-40%
10%/yr
0.47x
never came
FBRT
Franklin BSP Realty Trust, Inc.
-38%
10%/yr
0.50x
never came
Educational example. Returns use adjusted closes; revenue
windows align fiscal years to price windows approximately (±1 year
tolerance); compression uses current market cap over latest-FY revenue and can
shift with dilution and fiscal-year timing. Foreign-filer coverage relies on a
secondary data source. Not investment advice.